Instance Monitoring
Database On Demand instances are monitored by telegraf which is an agent that sends metrics to a DBOD InfluxDB instance. The monitoring is accessible through the Web Interface and will appear in a new window or tab of your browser, please be sure of that your browser is not blocking pop-ups:
Accessing to Grafana will show automatically the real-time activity of the selected instance. It is possible to change adjust the time intervals in the upper right drop down menu of Grafana.
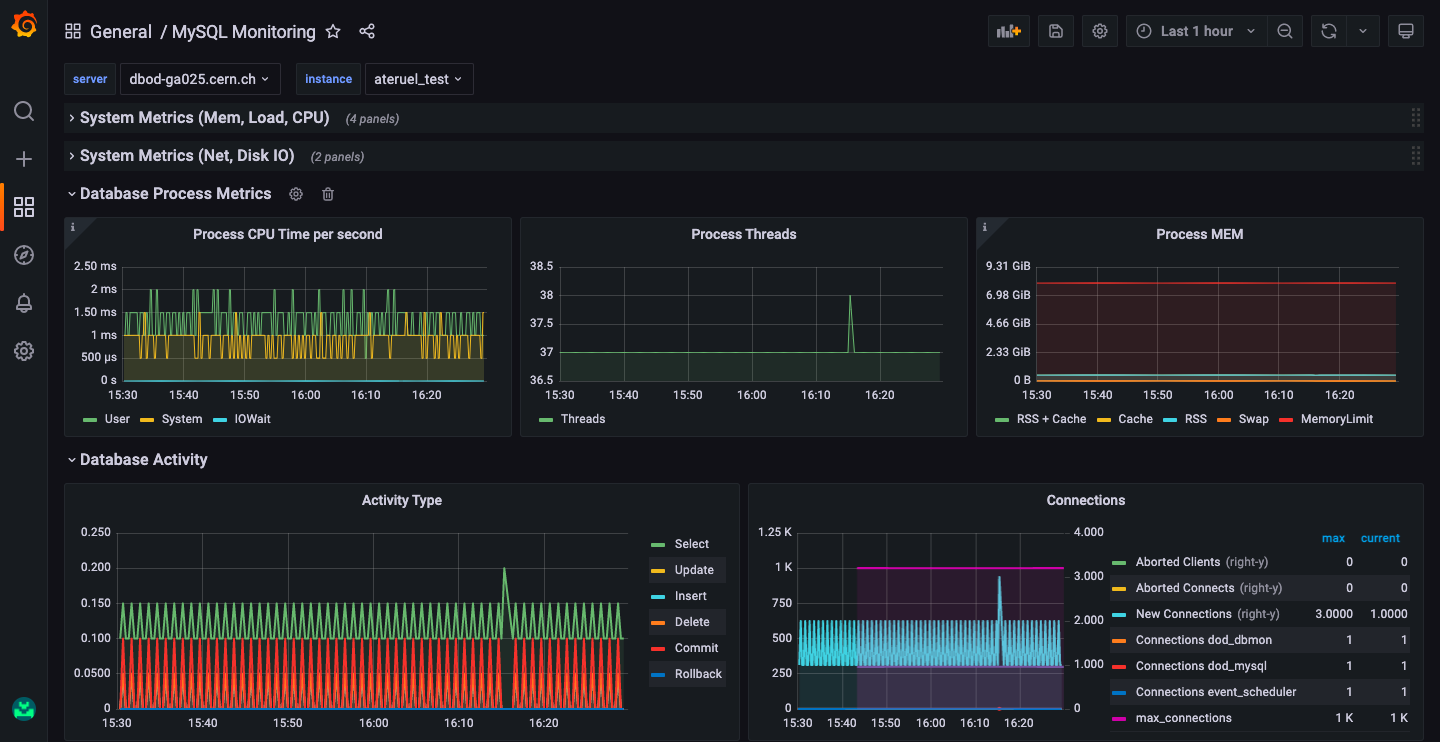
By default, the new window will open a Grafana dashboard showing the Database Activity row unfolded and a set of different rows, showing other metrics, folded:
Each row contains different plots depicting different system, database, backups and storage metrics.
The different rows are distributed as follows:
System metrics (Mem,Load,CPU): shows memory and CPU metrics of the host at which the DBOD instance is running on.
System Metrics (Net, Disk IO): show network usage and Disk IO of the host at which the instance is running.
Database Process Metrics: shows real time and historical cpu and memory used by the database process.
Database Activity: shows different database process metrics like: deadlocks, Innodb Buffer Pool Usage, Number of connections, table activity, etc.
Database Replication Metrics: The plots shown in this row are only valid for replica instances. It shows the real time replication lag, the status of the replication threads and read_only mode among other metrics.
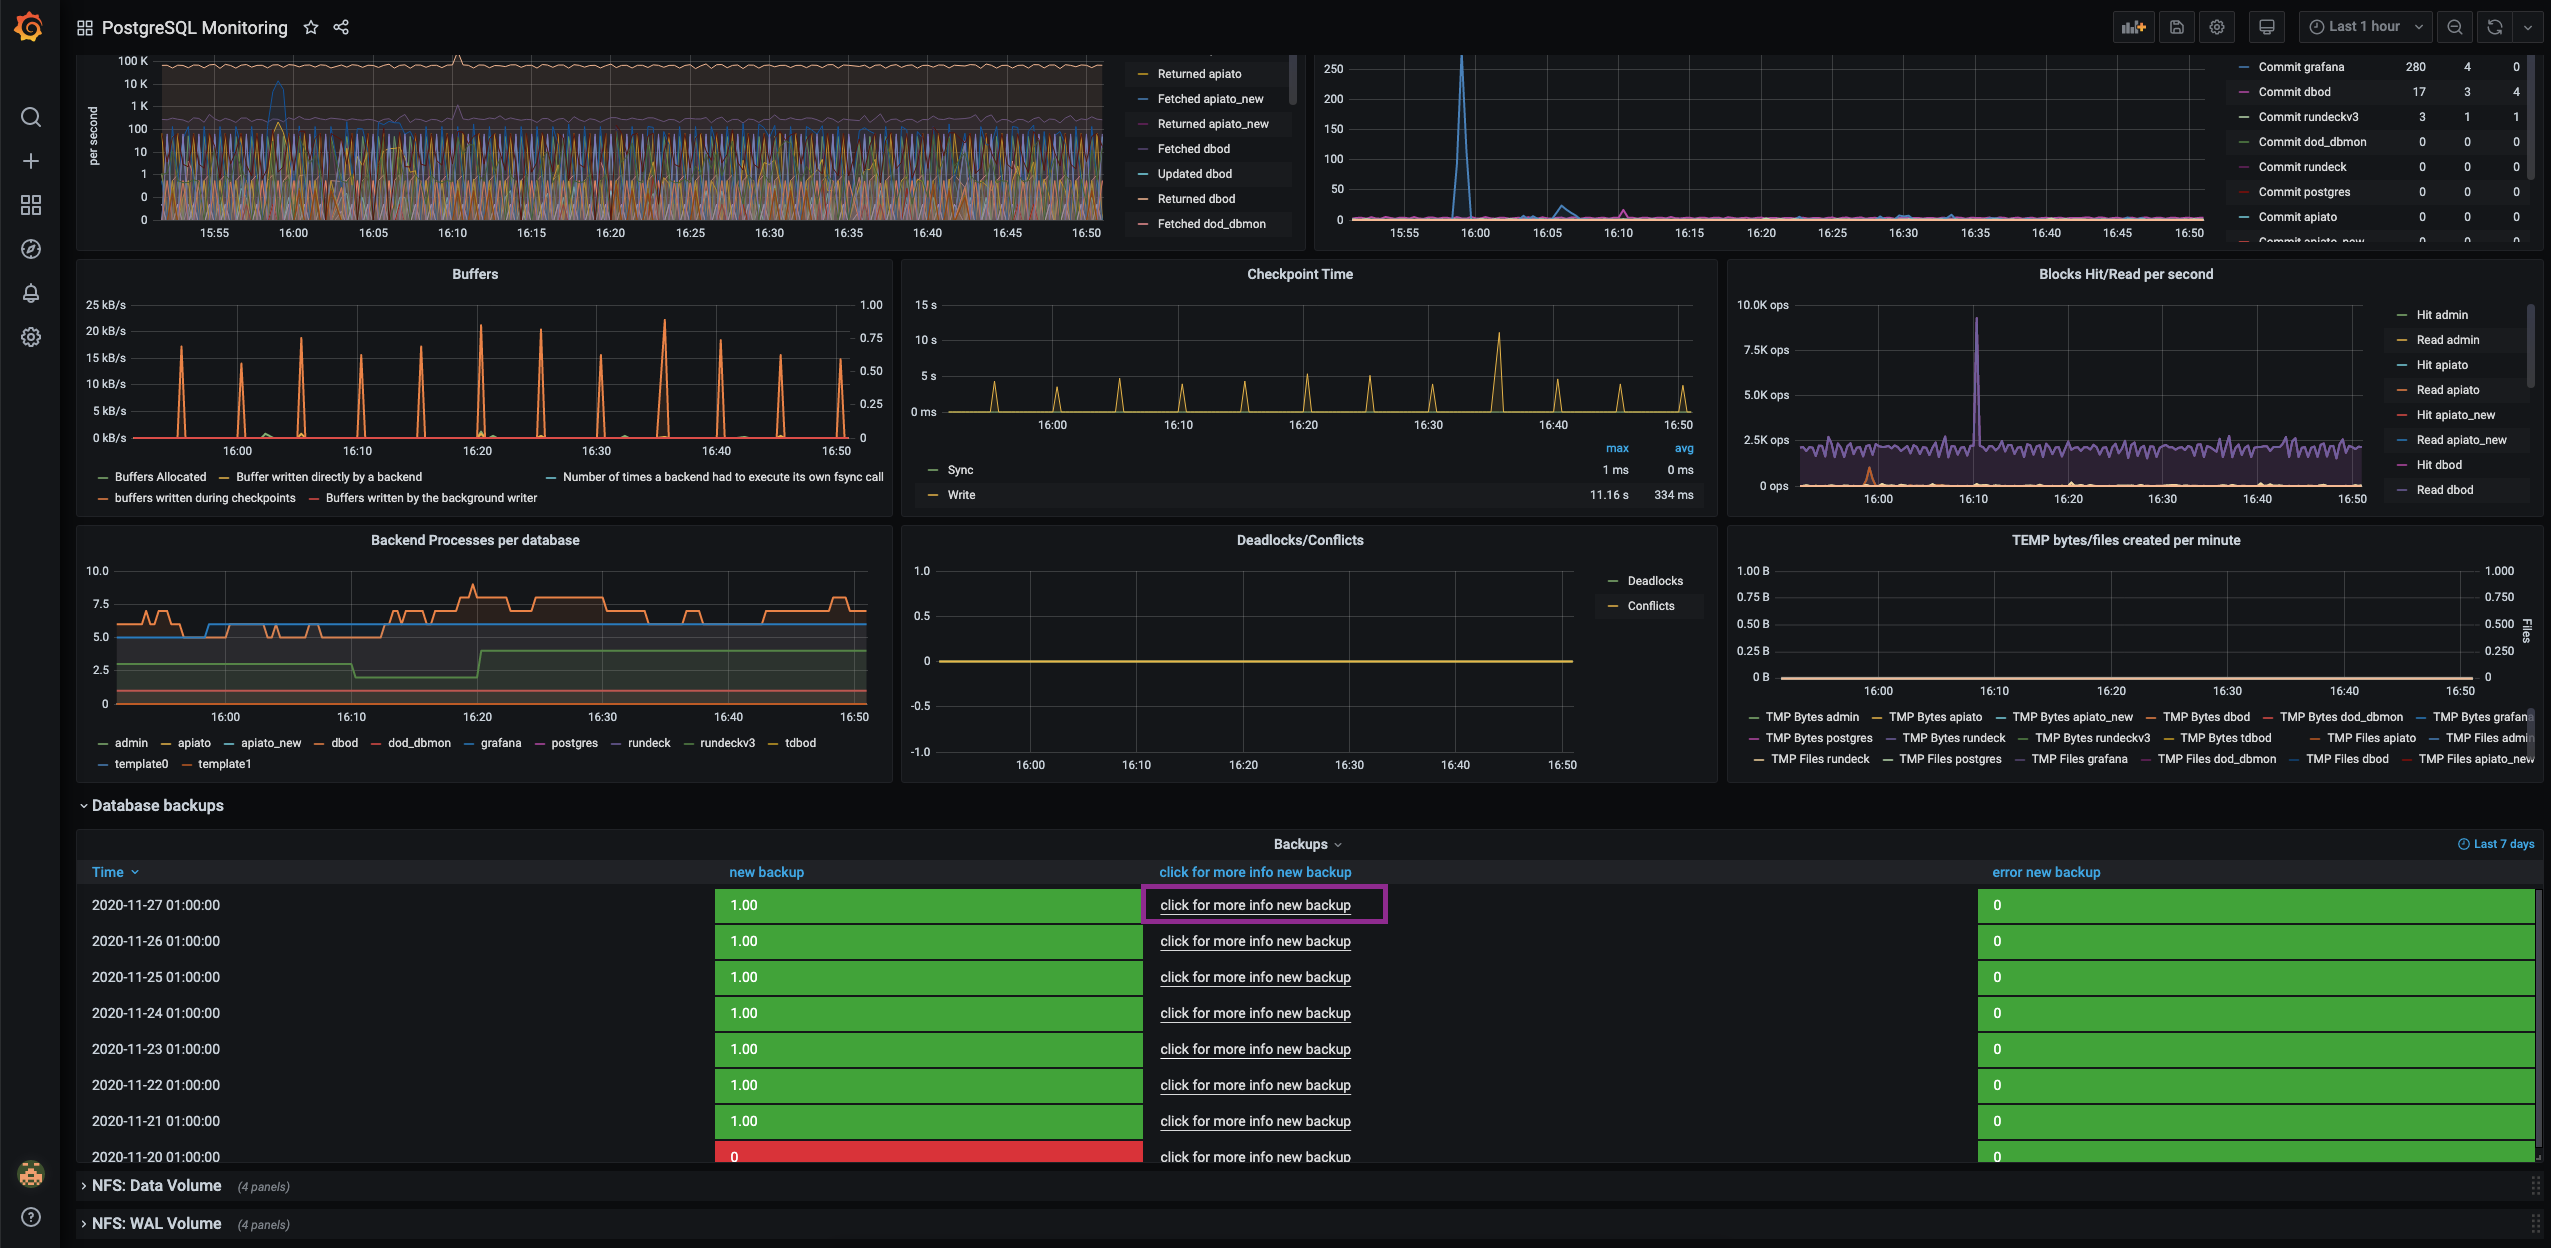
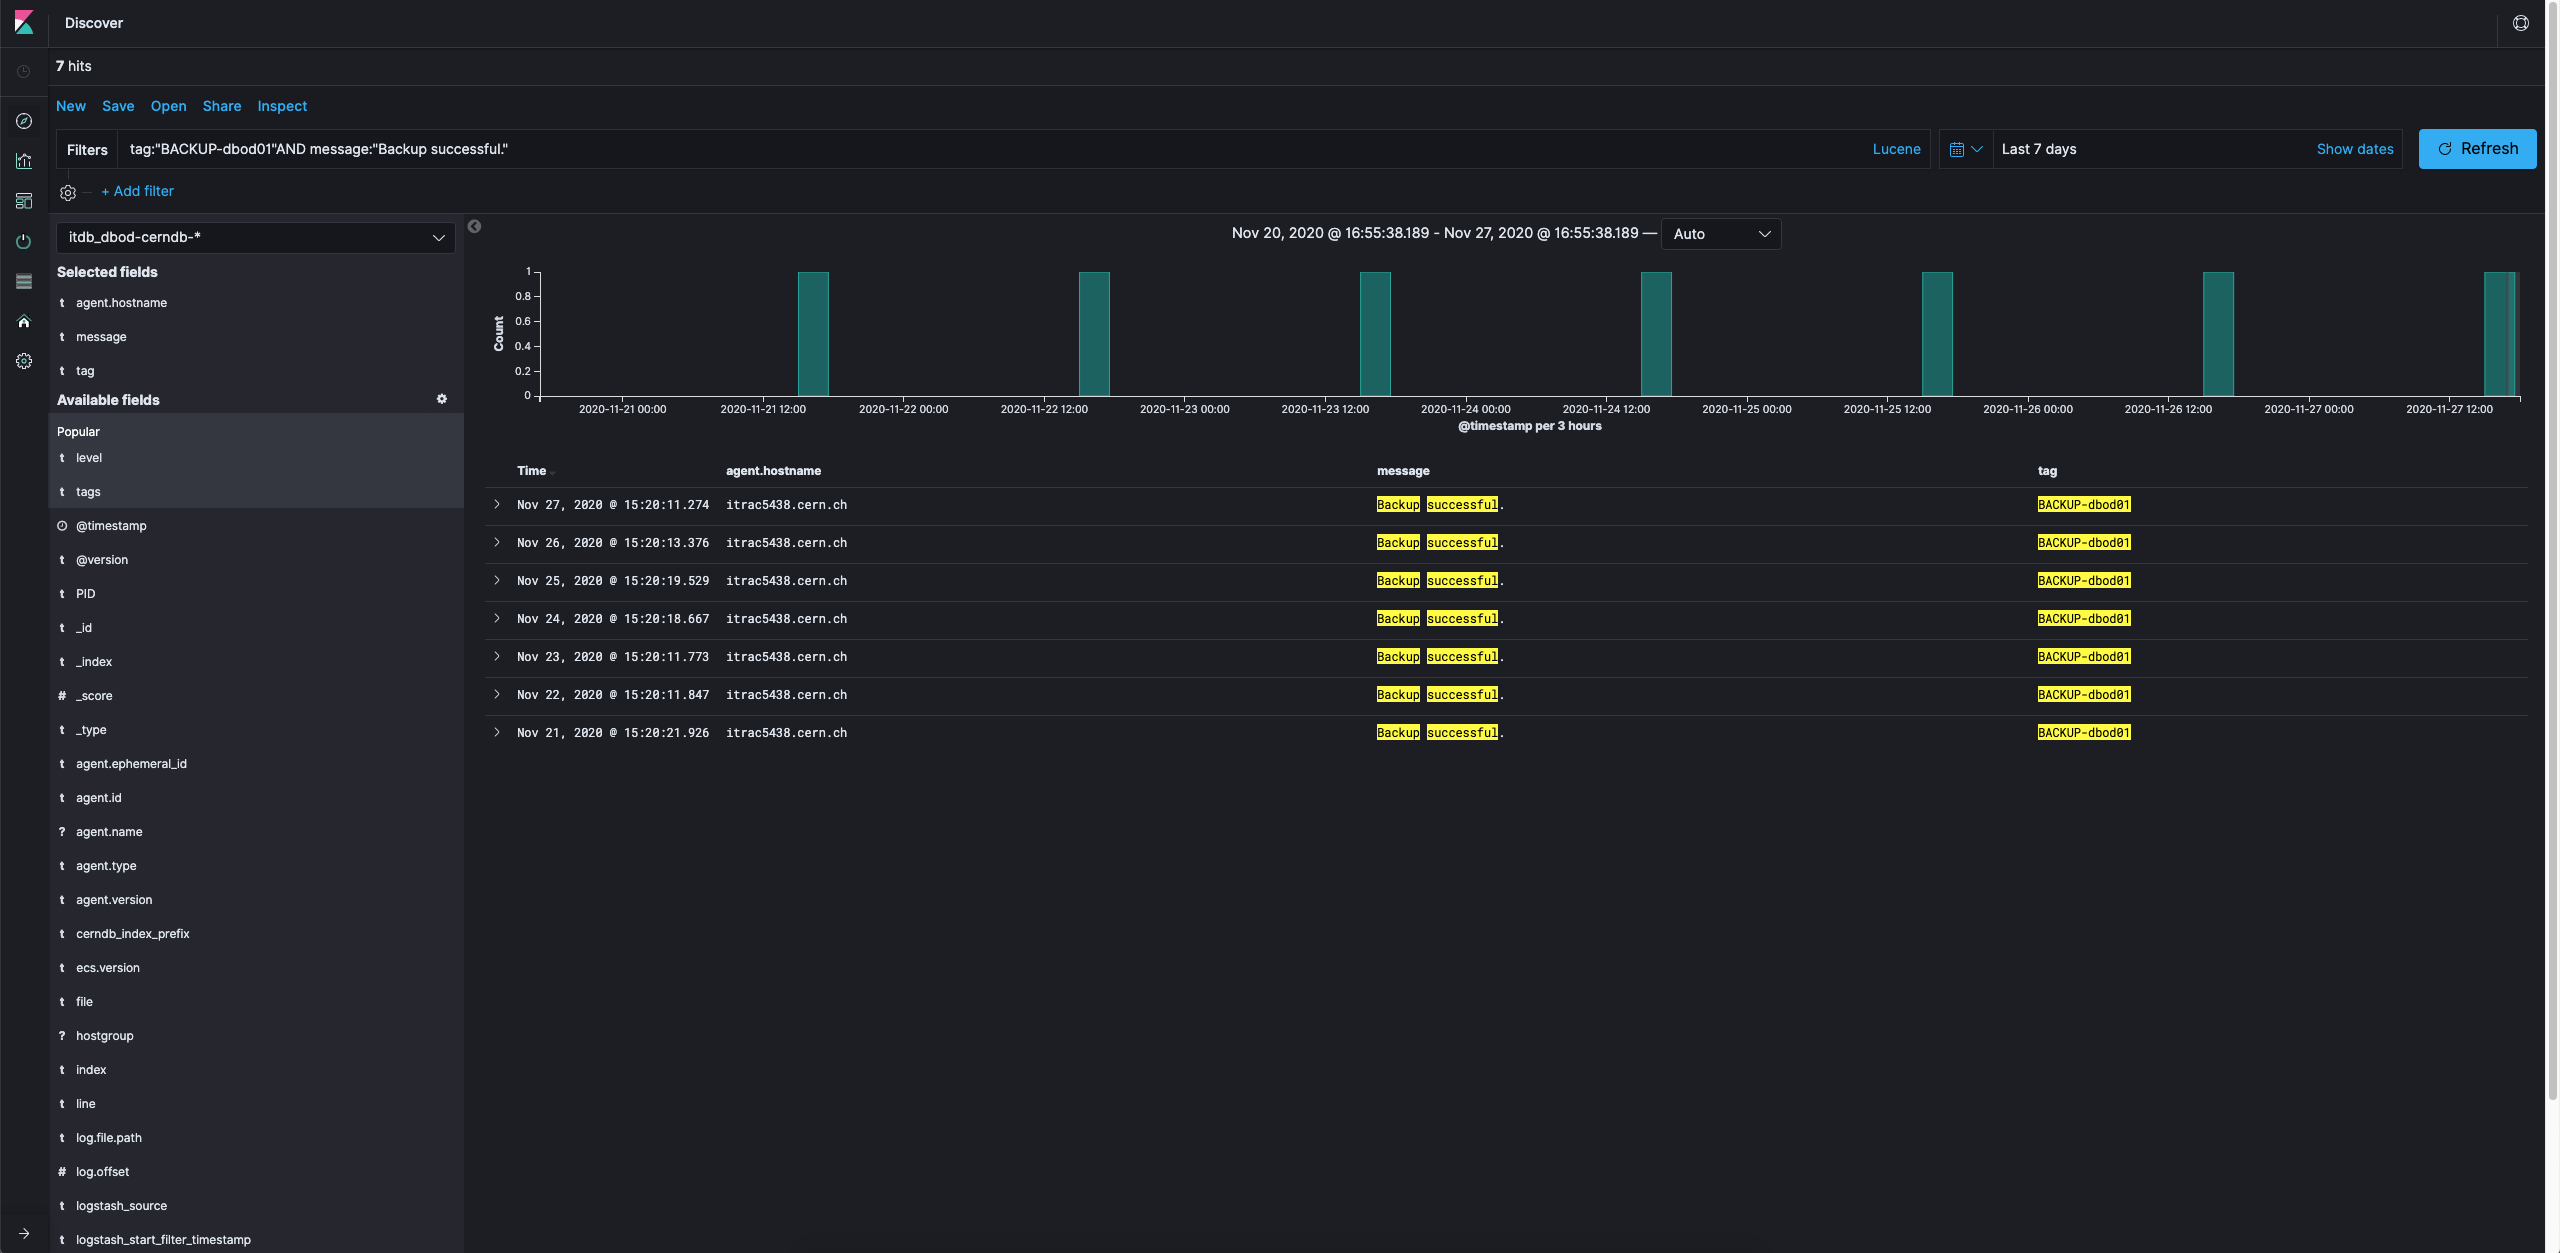
Database backups: show the status of the most recent backups taken for the instance. Clicking on the link "click for more info":
It will open a new Kibana window or tab in your browser were you can see more detailed logging information about the latest backups.
NFS: Data Volume: all the DBOD instances have their storage split in two different NFS volumes. This row shows a set of plots showing metrics like the data volume size and the data latencies of the data volume of the instance.
NFS: WAL Volume: shows a set of plots showing metrics like the WAL volume size and the WAL data latencies of the WAL volume of the instance.